This score renders Synology DSM notifications on the Tempo timeline: storage, security, system, and backup events. It is read-only. The actions open DSM and its applications, SSH or ping the NAS, copy details for a ticket, or open Synology’s documentation. Nothing writes back to the NAS.
Synology is a built-in source. It ships with Tempo and registers on first launch, so there is no .tempo-score file to download and no helper to run. DSM 7 includes a Custom Webhook notification transport, and DSM posts to Tempo directly over the LAN. The work below is configuring that webhook once.
Experimental. This score was built from Synology’s official Custom Webhook documentation and has not been verified end-to-end on live hardware. The test unit died and was disposed of before verification. Treat the body template and the field mapping as a starting point and adjust them to your DSM version if events arrive looking wrong.
How it works
DSM’s Custom Webhook posts a JSON body straight to Tempo’s ingestion server on the LAN. No relay or adapter sits in between.
The important constraint is what DSM puts in that body. The Custom Webhook exposes a single reliable substitution token, @@TEXT@@, which expands to the rendered notification body as a human-readable string, already localized to your DSM language. DSM does not send structured fields (no severity, no event category, no machine identifier). So the body template you author in DSM hardcodes the NAS hostname and copies the @@TEXT@@ string into the metadata keys the score reads.
Because the only real signal is that localized string, the score derives severity by keyword-matching the subject text rather than reading a severity field. This is covered under What you’ll see.
Setup
- In Tempo, open Settings → Ingestion and add a token bound to
com.synology. Copy it; you will paste it into DSM in step 3. - Note your Tempo endpoint:
http://<your-mac-hostname>:7776/ingest(use127.0.0.1only if Tempo is loopback-only and DSM runs on the same Mac, which is unusual). - Configure the DSM webhook (below).
DSM side: configure the Custom Webhook
Open Control Panel → Notification → Push Service → Webhooks → Add → Custom.
| Field | Value |
|---|---|
| Provider Name | Tempo |
| URL | http://your-mac.local:7776/ingest |
| HTTP Method | POST |
Under HTTP Headers, add:
| Key | Value |
|---|---|
Content-Type | application/json |
X-Tempo-Token | <paste token from Tempo> |
Under HTTP Body, paste this template. The only value you change is hostname.
{
  "title": "@@TEXT@@",
  "providerIdentifier": "com.synology",
  "eventType": "alert",
  "metadata": {
    "hostname": "nas.home.arpa",
    "subject": "@@TEXT@@",
    "message": "@@TEXT@@"
  }
}hostname: the hostname or IP of your NAS. Every “Open DSM”, “SSH”, and “Ping” action builds on it. The webhook UI does not reliably substitute a host placeholder inside JSON body content, so hardcode the value here. It is a one-time edit per NAS.subject: the text the severity rules match against. It is set to@@TEXT@@because that string is all DSM sends.message: the text the “Copy message” action copies. Also@@TEXT@@.
Under Events to notify, enable the categories you want Tempo to receive. System, Storage, Security, and Backup are the useful ones. Save.
To confirm delivery, select the Tempo row and use Send Test Message. A new alert should appear in Tempo’s feed within a second or two.
What you’ll see
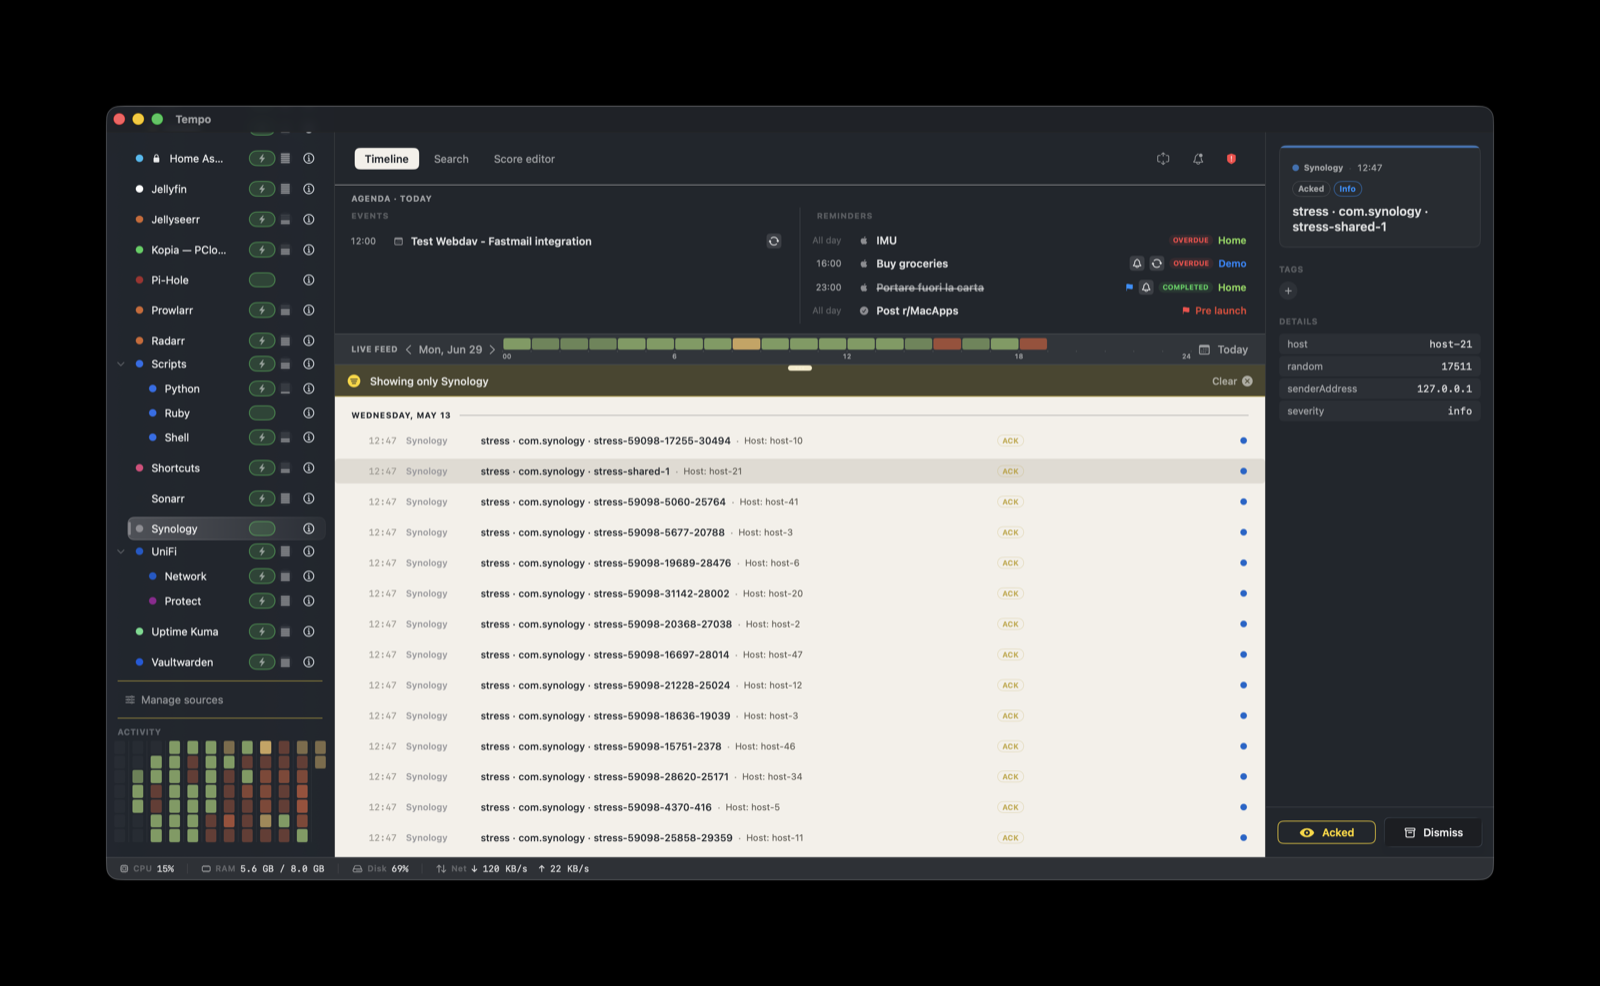
Tempo receives a short summary string per notification, for example “Drive 3 on DS920+ has been disabled”, rather than structured data. The score matches that string against 15 keyword rules, in order, and assigns the first match. Anything that matches nothing defaults to info.
| Severity | Subject contains |
|---|---|
| critical | Critical, Attack, Intrusion |
| error | Error, Failed, Crashed, Degraded, Disabled |
| warning | Warning, Full, SMART |
| info | Backup, Snapshot, Login |
| ok | Completed |
| info | (default, no keyword matched) |
This is best-effort pattern matching on localized text, not a structured severity field. The keywords are English, so results depend on your DSM display language and the exact wording DSM uses. If your DSM runs in another language, the matches will be less accurate and most events will land as info. The audit (the shield icon) shows the raw payload if you need to verify what arrived.
Grouping and actions
Events stack within a 6-hour window. The primary grouping key is the NAS hostname plus the subject text, so repeated notifications about the same condition read as one entry. The fallback key is the hostname alone.
Ten actions are attached to every event:
| Group | Actions |
|---|---|
| DSM apps | Open DSM, Open Storage Manager, Open Log Center, Open Security Advisor |
| Shell | SSH to NAS, Ping NAS |
| Clipboard | Copy hostname, Copy message |
| Docs | DSM notifications docs, Synology Knowledge Center |
The DSM application actions open https://${metadata.hostname}:5001/ with a launchApp parameter for Storage Manager, Log Center, and Security Advisor. “SSH to NAS” opens ssh://admin@${metadata.hostname}. “Ping NAS” opens Terminal with ping ${metadata.hostname}.
Customizing the actions
- Non-default DSM port: if DSM’s HTTPS port is not 5001, edit the
openURLin each “Open” action. - Non-admin SSH user: replace
admin@in the SSH action with your username. - Multiple NAS: create one webhook per NAS in DSM, each with its own
hostnamein the body template. All events land in this score, and the per-event hostname drives the actions.
Troubleshooting
If a test notification does not appear in Tempo, work through these checks in order. Each isolates a different layer.
1. Is Tempo reachable from the NAS? SSH to the NAS and run:
curl -v http://your-mac.local:7776/healthA 200 OK means reachability is fine. A timeout or “No route to host” is a network problem (a firewall on the Mac, Wi-Fi client isolation, or VPN routing). Nothing else works until this passes.
2. Does the token work and is the payload accepted? Still on the NAS, send a synthetic event that mirrors the body template:
curl -X POST http://your-mac.local:7776/ingest \
  -H 'Content-Type: application/json' \
  -H 'X-Tempo-Token: YOUR_TOKEN_HERE' \
  -d '{"title":"synology probe","providerIdentifier":"com.synology","eventType":"alert","metadata":{"hostname":"nas.home.arpa","subject":"probe","message":"manual test"}}'
The event appearing in Tempo’s feed means ingestion works end-to-end. A 401 means the token is wrong or not bound to com.synology. A 422 means the JSON is malformed; the DSM webhook editor does not validate JSON, so this is a common cause.
3. Are packets reaching the Mac? Watch inbound traffic on the Mac, then send a DSM test message:
sudo tcpdump -i any -A 'tcp port 7776 and src host your-nas.home.arpa'You should see the HTTP POST with the JSON body. If nothing arrives even though step 1 passed, the webhook URL in DSM is typed wrong or points at the wrong host.
4. What did Tempo record? Grep the rolling file log:
grep -h com.synology ~/Library/Application\ Support/Tempo/Logs/tempo-*.log | tail -50Every Synology event Tempo has handled appears here with a timestamp and outcome. Settings → Help → Export diagnostics bundle packages the same logs for support.
Events arrive but every severity is info. The subject string did not match any keyword. Check your DSM display language; the keywords are English. Inspect the raw payload in the audit to see the exact text DSM sent.